How to Install Grafana on Debian 11 and Use It Like a Pro

 10m
10m
 0 comments
How to install Grafana on Debian 11 and get the most out of its features? If you are looking for a tool to manage data and display results in a graphical and practical way, Grafana can be the best choice for you. This tool allows you to display and analyze data in the form of completely customized charts, graphs, and dashboards and is known as a great tool for monitoring the performance of systems, networks, and servers. In this article, we will teach you how to install Grafana on Debian 11 and then we will explore some interesting features and capabilities that may even surprise some of you!
Why should you install Grafana on your systems?
Before we get to the installation, it is better to know why Grafana has become so popular and why many companies and developers use this tool. One of the main advantages of this tool is its unique capabilities in displaying data in a graphical and very attractive way.
Grafana allows you to create all the important data and information in the form of fully customized dashboards. For example, you can create a dashboard to monitor the status of servers, the status of network traffic or anything else you need.
Did you know?
Grafana is currently used by more than 150,000 organizations around the world. This includes various industry sectors such as IT, healthcare, manufacturing and much more
How to install Grafana on Debian 11
Now that you are familiar with the features of Grafana, let’s check the steps for installing this powerful tool on Debian 11. Very simple and fast!
Step 1: Update the system
Before doing anything, you should make sure that your system is up to date so that there are no problems during the installation process. To update your system, just type this command:
sudo apt update && sudo apt upgrade -y
Step 2: Install Prerequisites
To install Grafana, you need to install a few packages that will connect you to online repositories and manage software packages. To install these packages, type the following command:
sudo apt install -y gnupg2 curl software-properties-common dirmngr apt-transport-https lsb-release c-certificates
Step 3: Add the Grafana Repository
Now it’s time to add the Grafana repository to your system so that we can install this tool. Type the following commands to add the repository and import the GPG key:
curl https://packages.grafana.com/gpg.key | sudo apt-key add -
sudo add-apt-repository "deb https://packages.grafana.com/oss/deb stable main"
sudo apt update
Step 4: Install Grafana
Now that the repository is added, it’s time to install Grafana. To do this, enter the following command:
sudo apt install grafana -y
Step 5: Start the Grafana service
After installation, the Grafana service needs to be started. You also want this service to start automatically every time the system boots. Do this by entering the following commands:
sudo systemctl start grafana-server
sudo systemctl enable grafana-server
Step 6: Configure the firewall
If you are using a firewall, you need to open port 3000, which is used to access the Grafana dashboard. To this:
sudo ufw allow 3000/tcp
Step 7: Access the Grafana Dashboard
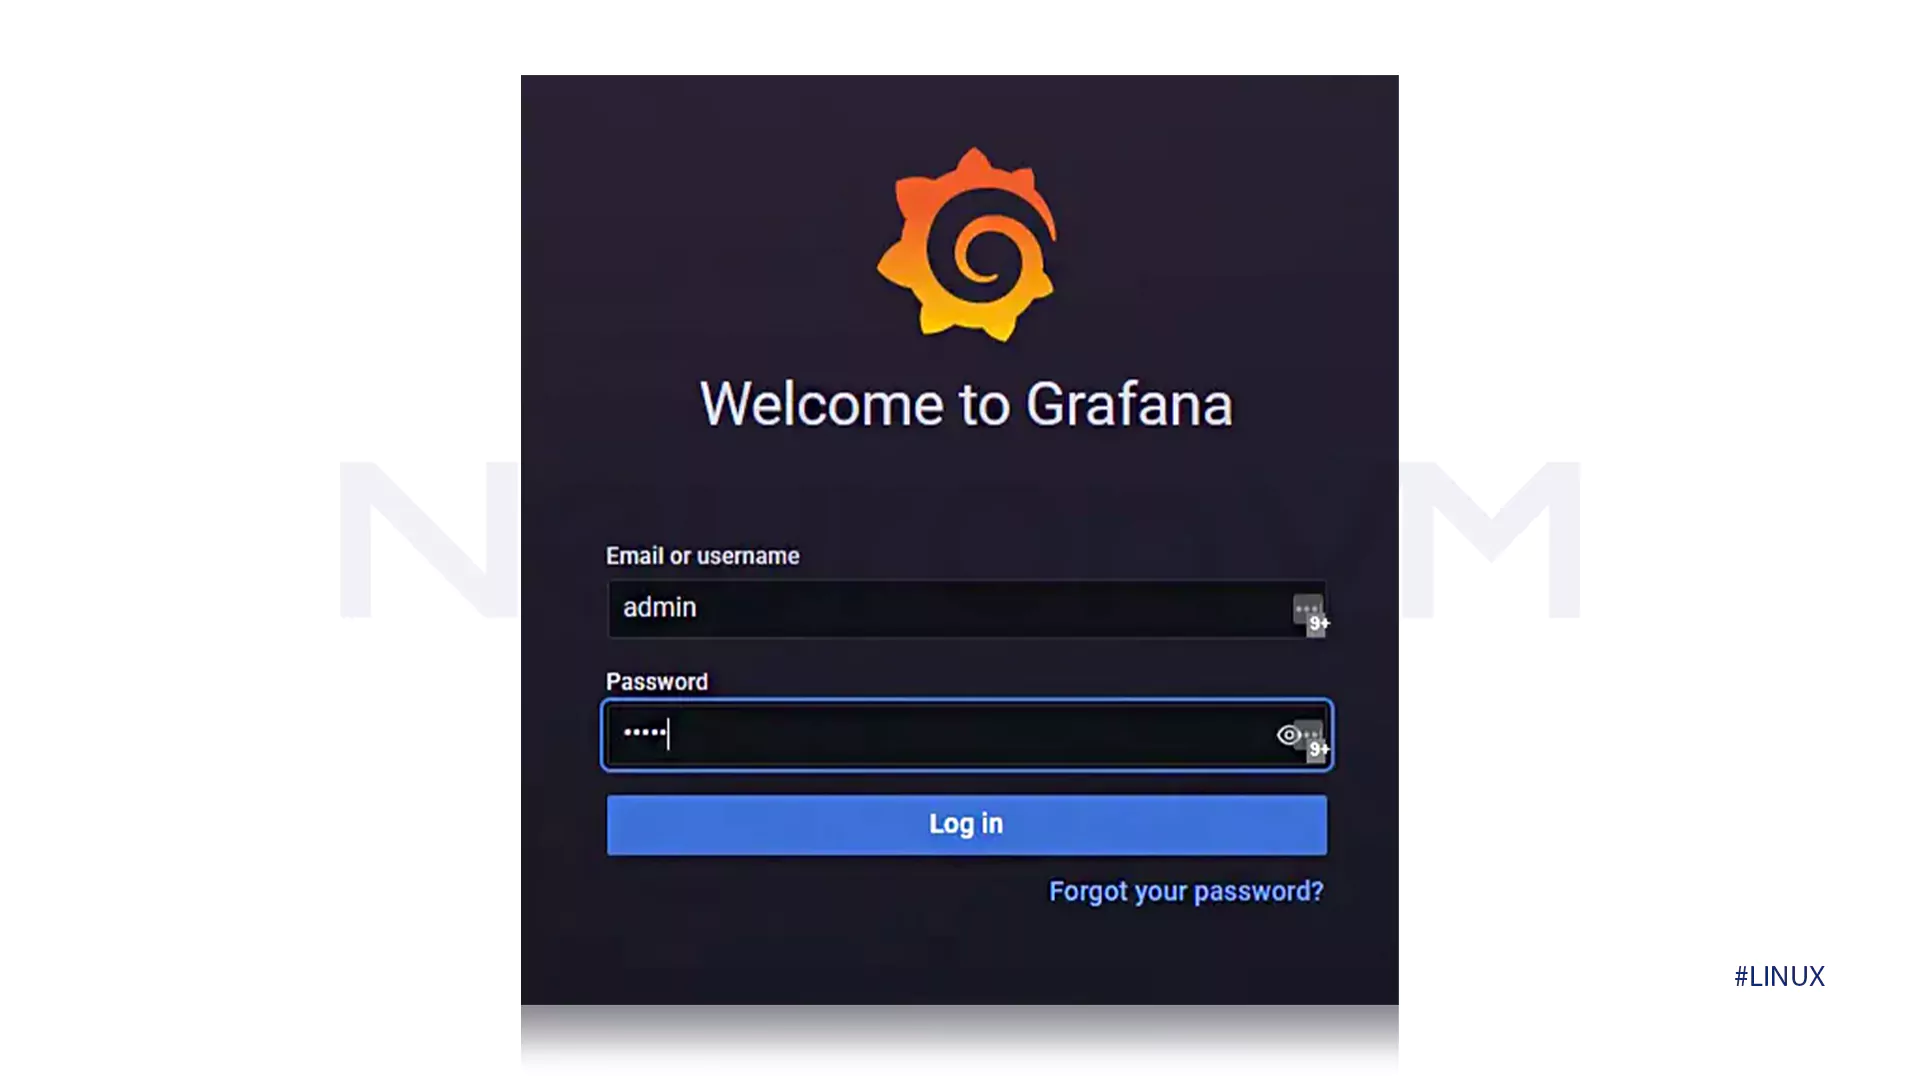
Now that everything is ready, you can access the Grafana dashboard through a browser!!! Go to the following address:
http://your_server_ip:3000
To log in, the default username is admin and the default password is admin. After logging in to the dashboard, you can start creating your charts and graphs.
Practical tips for better use of Grafana
1. Fully customized dashboards
One of the great features of Grafana is that you can create dashboards that exactly meet your needs. This means you can create a dashboard that only shows data related to your server and another dashboard that only shows the status of your network.
2. Alerts and Notifications
With Grafana, you can set up alerts to notify you when, for example, CPU usage increases or memory runs low . This feature helps you stay informed about the status of your system.
3. Analyze various data in one place
One of the attractive features of Grafana is that you can connect to multiple data sources such as Prometheus, InfluxDB, and Elasticsearch and analyze data from different sources in a unified manner.
4. Ability to view historical data
Grafana allows you to save your data history and easily review it at any time!! This feature is especially useful for analyzing long-term trends.
Some experiences from Grafana users
User A: “Using Grafana = I was able to create a dashboard that graphically displays the status of server resource consumption. This helped me identify problems much faster.”
User B: “I am personally very happy with Grafana’s alerting capabilities. As soon as the CPU usage exceeds the normal limit, I get a notification, which makes me act much faster.”
User C: “As a developer / using Grafana to analyze data from various projects has been very convenient and useful. The fully customizable dashboards have allowed me to analyze everything according to my needs.”
Conclusion
Grafana is not only a tool for displaying data graphically, but with the various features it offers, it can greatly help in monitoring and analyzing systems , servers, and networks. Installing and setting up this tool on Debian 11 is very simple, and by following the steps above!!! you can easily utilize the power of this tool to manage your data and systems . Statistics show that using tools like Grafana reduces the time to identify system problems by 30% which helps companies and developers find problems faster and perform better.
Grafana allows you to create custom dashboards that give you a clear and graphical view of the health of your systems, servers, and networks. You can monitor system performance in real time and easily identify problems with Grafana. You can also use alerts to get notified when problems occur.
No, Grafana allows you to analyze data from multiple sources, including Prometheus, InfluxDB, and Elasticsearch. In addition to servers, you can use Grafana to monitor and analyze network data, various resources, and even applications.
No, installing Grafana on Debian 11 is very simple and you can get this powerful tool up and running in just a few steps. Just use the commands explained in the article step by step to install Grafana in the shortest possible time and take advantage of its features.


