

How to Trace on Windows RDP for 10, 2012, 2016, 2019


 6m
6m
 0 comments
 Print
Print
If you have trouble opening a site on the Internet or connecting to a system, you can use the Traceroute command to find out where your connecting problem is. This command can also show a route map from your computer to the Webserver on which the website is located. On a Windows machine, this command is called Tracert and on Linux and Mac, it’s called traceroute. In this article, we will explain the use of the Traceroute command in the network. In other words, we want to teach you step-by-step How to Trace in Windows RDP [10-2012-2016-2019].
Requirements
To run Traceroute on Windows RDP, you will need to ensure the following requirements:
1) Processor: A multi-core processor with at least 2 or more cores
2) RAM: A minimum of 4GB RAM should be sufficient.
3) Network Interface Card (NIC): A server-grade NIC with fast Ethernet or Gigabit Ethernet capabilities is essential for efficient network communication.
If you want to Admin RDP, we suggest you to use the attractive plans presented on our website, which have high performance and variety of locations.
Tutorial Trace on Windows RDP
In this section, we are going to teach you how to Trace on Windows RDP. This tutorial is for Windows 10, 2012, 2016, and 2019. Follow the steps below in order.
To trace the Windows operating system, first, open the Start menu and search for the word CMD or Command Prompt in the Search section. Open the specified option to enter the CMD environment:
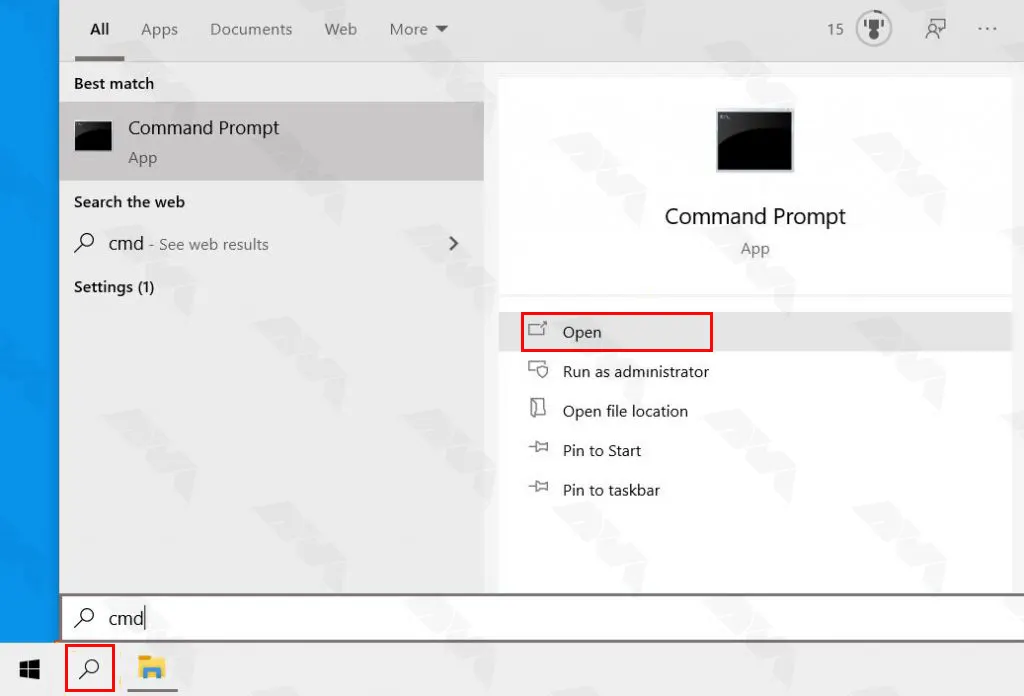
Note: You can also use the Windows+R keys to open the Run section and in this section enter the word CMD to launch the relevant section and click OK.
Then type the word Tracert in this section and press the Space key to space. Enter the domain or IP and press Enter:
tracert 8.8.8.8
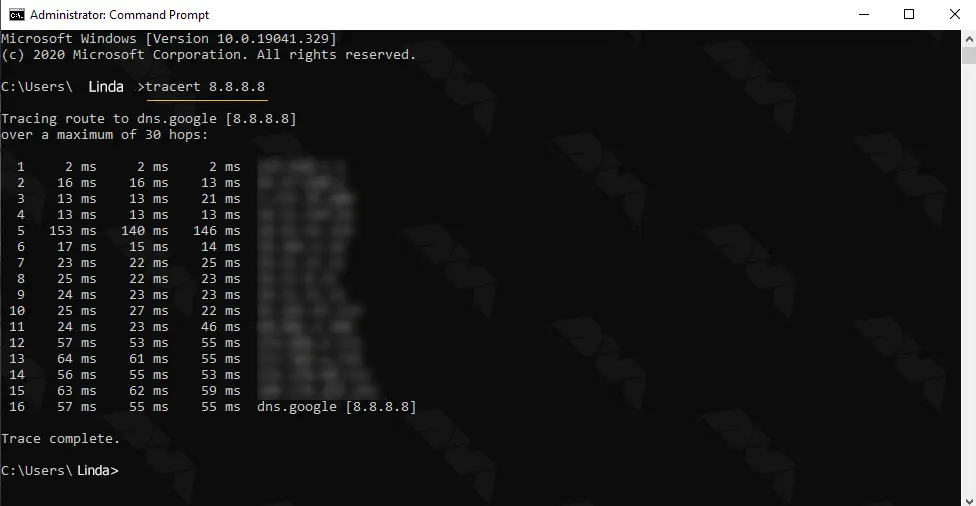
Wait a while for the tracing process to complete and encounter the message “Trace complete“. Finally, you can see the image of the data path from different servers.
Eventually, press Enter.
Columns analysis in Traceroute Output
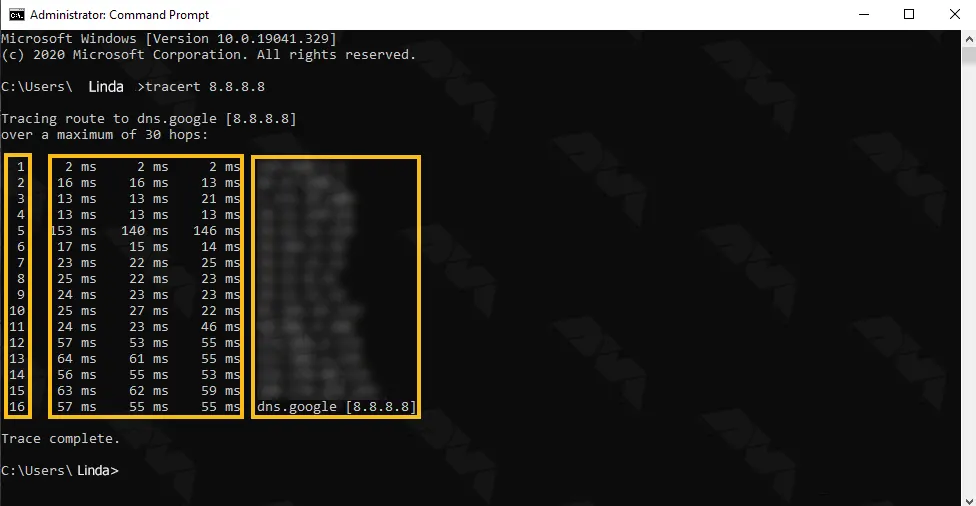
After taking the output of Trace, you will see 5 columns, each of which represents a specific concept, which we will discuss below:
To the left of the first column is the hop number and the last column is the IP or Hop name. Between these two columns that we described, there are 3 other columns. These 3 columns are related to the packages sent from our system to Hop, by sending them we will receive a more valid output. The time of sending and returning each package is the same amount that is placed in each of these 3 columns.
The first output hop will be your modem IP if you are using a modem. After completing the trace, the last hop displayed is the domain or IP that you traced. Existing IPs start with 10. IPs are private and belong to telecommunication networks and intranets.
Conclusion
Tracing on Windows RDP is a valuable technique for troubleshooting and analyzing remote desktop-related issues. By enabling tracing and accessing the generated log files, you can gather detailed information about RDP connections, allowing you to diagnose problems effectively. This comprehensive guide walked you through the process of enabling tracing on various versions of Windows RDP (2012, 2016, and 2019) and provided instructions on accessing and analyzing the tracing logs. By following these steps, you can efficiently trace on Windows RDP and resolve any encountered issues.